-
Dealing with unbalanced classes
Introduction There are a number of areas where the occurrence of the phenomena of interest is much rarer and less frequent than, well, the less interesting stuff. For example, less than 1% of all credit card transactions are fraudulent. Similarly, product defect rates in a well-run factory production line, or...
-
Interactive Tableau visualizations
I wanted to post a couple of interactive Tableau charts from previous projects here, both to check out what interactive features are available, and to provide additional insights. The mechanics for accomplishing this are fairly straightforward - save the worksheet to “Tableau Public” using the “Server” dropdown menu on the...
-
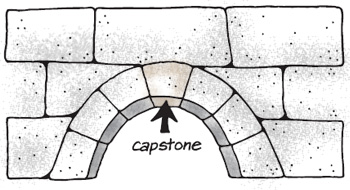
Predict pricing for tube assemblies used in Caterpillar equipment
Introduction This is my Capstone project for General Assembly’s full-time 12-week Data Science Immersive course. It is heavily inspired by a 2015 Kaggle competition (Kaggle Caterpillar tube assembly pricing), but with some additional goals. I wanted to create not just a pricing model, but also: a) Clearly formulate and explain...
-
Understanding delays at major USA airports
Introduction This week, I will explore delays at major airports in the USA, and try to understand if there are groupings of airports that perform similarly based on a number of operational and delay metrics available from the Federal Aviation Administration (FAA). This could be a first step in trying...
-
Predicting IMDB Top 250 movie ratings
Introduction This week, I will explore ratings for the Top 250 movies of all time on IMDB. The goal is to see what characteristics of these movies correlate to their IMDB ratings. I will solely explore tree-based ML techniques in this post (decision trees and ensemble methods). Objective There are...
-
Predicting survival on the Titanic
Introduction I will explore a dataset about various characteristics of the passengers on the ill-fated Titanic this week. A more comprehensive description of this dataset is available at https://www.kaggle.com/c/titanic and https://www.kaggle.com/c/titanic/data. Objective There are 2 main goals of this study: Understand which features affect survival Build Logistic Regression, kNN and...
-
Iowa liquor sales 2015-2016
Introduction Iowa’s government provides rich datasets on their Open Data website (https://data.iowa.gov). This week, as part of my Data Science Immersive class at General assembly, I want to explore liquor sales in Iowa from establishments holding Class E liquor licenses, i.e. those that allow for the sale of liquor for...
-
Billboard top 100, circa 2000
Introduction The billboard top 100 provides weekly rankings of tracks (aka singles) based on the amount of radio play, online streaming, and physical and digital sales. The number of weeks a track spends in the top 100 could be interpreted as a proxy for its popularity. As part of my...

Karthik Venkataraman, PhD